Statistics and Measures, Test Scores and Performance Assessment, How These Should Be Applied
When one is prescribed statin medicines, blood tests are required 1-3 months after the start of the treatment. After about a year, the blood tests become less frequent to just once or twice every year. Statins are drugs that interfere with a body's capacity to make cholesterol. Thus, these drugs are usually prescribed to patients that have high risks for heart disease or stroke. The blood tests are necessary to monitor a patient's cholesterol, fatty acids and glyceride levels as well as possible side-effects on one's liver. Advances in health care take place with extensive research and arduous clinical trials. These trials involve a representative sample, extensive enough to allow for conclusions or generalizations to be drawn. In spite of these trials, implementation still comes with a watchful eye of a physician. In statistics, there are outliers and in real life, there are side effects. This applies not only to drugs but also to diagnostic procedures or tests. There is a difference between what is generally observed and what exactly applies to an individual. This simply comes from the fact that where statistics is relevant, there is a range of values. There are false positives and there are false negatives.
Education, similar to health care, also involves people. The fact that every person is unique translates to every teacher and every student being unique. Research on education therefore make use of statistics oftentimes. These analyses are indeed useful in providing a general picture of what is going on. Exams given to any class of students provide the teacher with feedback. The statistical values of mean, median, mode and standard deviation give a teacher an overview of where the class currently stands. These numbers, however, do not offer a complete picture for any individual student. Even the individual score of a student does not give a complete assessment of a student's learning. There are certain aspects of learning such as soft skills that are not measured by written exams.
In an assembly line, performance can be reduced to standard measures. A worker's productivity or output can be defined. Thus, managers turn to these measures to evaluate workers and decide who gets promoted, who gets bonuses, who gets demoted, and who gets fired. There is the temptation of applying the same logic to education and health care. Efficiency and objectivity are frequently associated with these quantitative measures. Unfortunately, both education and health care do not easily lend to these quantitative assessments. To appreciate this limitation, one must be reminded of the range or scatter inherently present in these measures.
Assessment of teachers is a thorny issue. Research evidently shows the intimate connection between teacher quality and students' learning outcomes. The relationship can not be denied and there are studies that have demonstrated the ability that some teaching evaluation methods have in predicting future students' performance. Opposition regarding the use of these measures for informational purposes is usually mild. Stronger protests usually come when these measures are tied to higher stakes' decisions such as bonuses, tenure and promotion. One of the strongest reasons behind the opposition comes mainly from the difficulty of extracting an individual point from a scatter or range of values. The correlation between measures of teacher quality and student performance is not a perfect fit and individual points do not perfectly lie along a straight line. The following are hypothetical curves (which simply take into account uncertainty in measurements) relating what one measures and what is true. In this particular case, teaching effectiveness is being measured.
If a cutoff score of 20, for example, is chosen for a personnel decision (retention, bonus, promotion, etc.) clearly there are both false positives and false negatives within the population. For instance, if 20 is chosen as the cutoff for salary bonuses, the false positives (blue points) will not receive the rewards because the measures incorrectly reflect their true effectiveness while the false negatives (red points) receive the bonuses even though these are not deserving. To avoid punishing the effective teachers, one may reduce the cutoff to 10, but this only leads to a much larger number of false negatives. The bonuses are now almost being awarded across the board. The hypothetical figure explains in part why performance based incentives do not really work that well in education. One should take note that the above is only hypothetical which takes into account only the statistical nature of the measures. Added to the above is the inherent limitations of such measures to capture and quantify teaching quality.
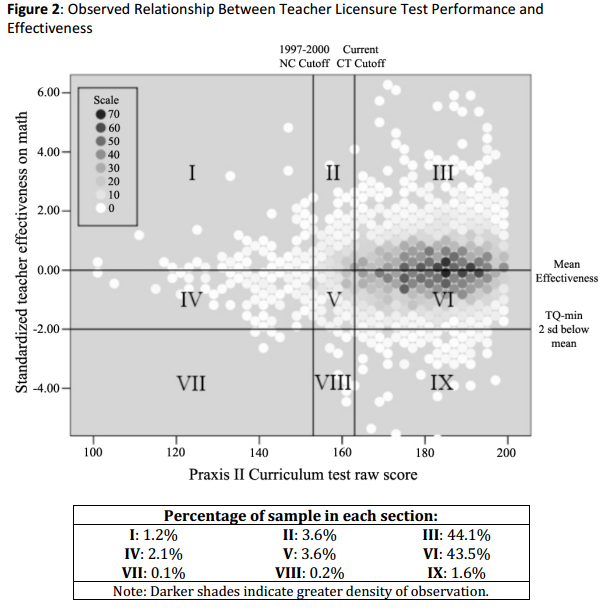
Another example given by Goldhaber and Loeb is the correlation between teachers' scores and licensure exams and student's performance in mathematics:
The vertical lines represent cutoff scores on the licensure exams that have been implemented in states like North Carolina and Connecticut. The scatter here is much higher and clearly the false negatives and false positives are quite substantial. These two examples provide a necessary perspective in viewing these measures. To appreciate fully the arguments made by this paper, Goldhaber and Loeb provide the following highlights:
Education, similar to health care, also involves people. The fact that every person is unique translates to every teacher and every student being unique. Research on education therefore make use of statistics oftentimes. These analyses are indeed useful in providing a general picture of what is going on. Exams given to any class of students provide the teacher with feedback. The statistical values of mean, median, mode and standard deviation give a teacher an overview of where the class currently stands. These numbers, however, do not offer a complete picture for any individual student. Even the individual score of a student does not give a complete assessment of a student's learning. There are certain aspects of learning such as soft skills that are not measured by written exams.
In an assembly line, performance can be reduced to standard measures. A worker's productivity or output can be defined. Thus, managers turn to these measures to evaluate workers and decide who gets promoted, who gets bonuses, who gets demoted, and who gets fired. There is the temptation of applying the same logic to education and health care. Efficiency and objectivity are frequently associated with these quantitative measures. Unfortunately, both education and health care do not easily lend to these quantitative assessments. To appreciate this limitation, one must be reminded of the range or scatter inherently present in these measures.
Assessment of teachers is a thorny issue. Research evidently shows the intimate connection between teacher quality and students' learning outcomes. The relationship can not be denied and there are studies that have demonstrated the ability that some teaching evaluation methods have in predicting future students' performance. Opposition regarding the use of these measures for informational purposes is usually mild. Stronger protests usually come when these measures are tied to higher stakes' decisions such as bonuses, tenure and promotion. One of the strongest reasons behind the opposition comes mainly from the difficulty of extracting an individual point from a scatter or range of values. The correlation between measures of teacher quality and student performance is not a perfect fit and individual points do not perfectly lie along a straight line. The following are hypothetical curves (which simply take into account uncertainty in measurements) relating what one measures and what is true. In this particular case, teaching effectiveness is being measured.
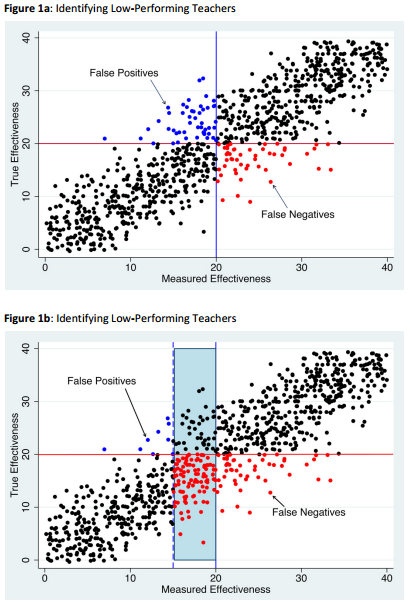 | |||
Figure downloaded from
Goldhaber, Dan, and Susanna Loeb. Carnegie Knowledge Network, "What are the Tradeoffs Associated with Teacher Misclassification in High Stakes Personnel Decisions?" Last modified April 2013. URL = <http://carnegieknowledgenetwork.org/briefs/value-added/teacher-misclassifications/>
|
Another example given by Goldhaber and Loeb is the correlation between teachers' scores and licensure exams and student's performance in mathematics:
 |
| Figure downloaded from
Goldhaber, Dan, and Susanna Loeb. Carnegie Knowledge Network, "What are the Tradeoffs Associated with Teacher Misclassification in High Stakes Personnel Decisions?" Last modified April 2013. URL = <http://carnegieknowledgenetwork.org/briefs/value-added/teacher-misclassifications/>
|
- Evaluating teachers to group them in performance categories will inevitably lead to mistakes, regardless of: when in a career a teacher is evaluated, whether the rating is for high or low stakes, and how the evaluation is conducted.
- Mistakes occur because true teacher performance is not fully observable. As a result, we have to rely on imperfect measures.
- While classification errors are an inescapable part of decisions that rely on grouping by teacher performance, better measurement of performance can reduce these errors.
- Classification errors can be separated into “false positives” – putting a teacher into a group to which he does not belong – or “false negatives” – not classifying him into a group into which he does belong.
- Classification errors associated with performance measures based on student test scores are quite high. But the error rate of these “value-added measures” may be lower than the error rate of classifications based on traditional measures of teacher effectiveness such as licensure status or years of experience.
- Current evaluation systems rarely classify teachers as ineffective or needing improvement. Thus, the “false negative” rate for these classifications is probably high.
- We have little research to draw upon for designing systems or for predicting the effects of emerging evaluation systems. This calls for caution and for a better understanding of new systems in action.
Comments
Post a Comment