Children from low income families do poorly in standardized math exams. Children who are either Hispanic or Black in the United States also do poorly compared to Asian Americans and Whites. There is an achievement gap that can be traced to race and socioeconomic status. The
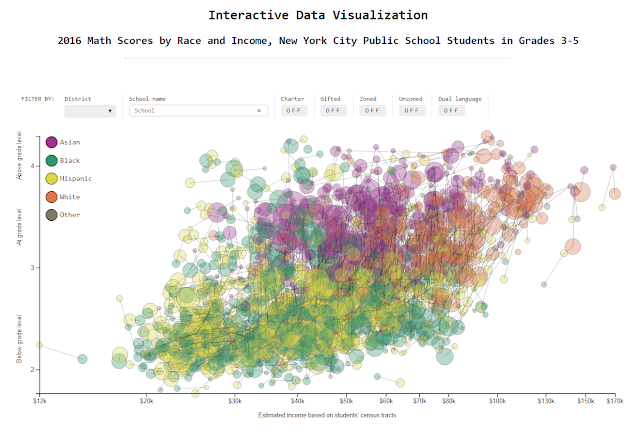
Integration Project at the Center for New York City Affairs has now provided us a tool to see these gaps for its 220,000 pupils in grades 3-5 in one graph:
 |
| Courtesy of the New School’s Center for New York City Affairs |
On the vertical scale of the axis are the scores in the 2016 State math test (a score of 3 means the student is performing at grade level), and on the horizontal scale are the estimated income of the student's family. We see mostly purple and orange (Asians and Whites) with both high math scores and high family income. Blacks and Hispanics, represented by yellow and green circles are mostly in the lower left side of the graph characterized by low scores and low family income. Students that belong to the same school are represented in the above graph by circles with lines connecting them. Below is an example.
 |
| Courtesy of the New School’s Center for New York City Affairs |
This is P.S. 77 Lower Lab School, where the majority of students are white (the orange circle is largest), followed by Asians and a few Hispanic, and other race. The scores are all above grade level and there are no gaps. One, however, should take note that this school is really serving a well-to-do community. On the other extreme of family income, we see the following example.
 |
| Courtesy of the New School’s Center for New York City Affairs |
The school, P.S. 111 Seton Falls, obviously serves mostly poor Hispanic and Black children. Students in this school are performing well below grade level in mathematics. There are schools in New York that have a diverse class. The following school even manages to have no achievement gap.
 |
| Courtesy of the New School’s Center for New York City Affairs |
Black children in this school come mainly from much lower income families than the White children but the difference in their scores is very small. The averages for each ethnicity in this school are all in fact above grade level. This, unfortunately, is more of an exception among schools that admit by lottery. Below is what we see often.
 |
| Courtesy of the New School’s Center for New York City Affairs |
Again, we are seeing the large green and yellow circles (Blacks and Hispanics) coalescing near the low score - low family income region.
The gaps are obvious. This is another illustration of how poverty affects basic education.


Comments
Post a Comment